Smallcaps outperform despite market down 1%; these stocks gain between 10-29%
- Market Insider Stock Market Stocks to buy Stocks to sell
admin
- 0
- 5 minutes read


The Indian benchmark indices lost 1 percent in the week ended October 20 as the investors remained worried over escalating conflict between Israel and Hamas in the Middle East region. The higher crude oil prices, US bonds yields hitting 5% for the first time since 2007, continued FII selling, monetary tightening to continue by Fed going ahead and mixed earnings from India Inc also dampened the investors sentiment.
In this week, BSE Sensex shed 1.33 percent or 885.12 points to finish at 65,397.62, while Nifty50 fell 208.4 points or 1.05 percent to end at 19,542.65.
Among the broader indices the BSE Small-cap index outperform as it ended on a flat note, however, BSE Mid-cap and Large-cap indices fell 1 percent each.
“Middle East tensions and elevated US bond yields steered the market to a consolidation path this week. A weak start to the earnings season, disappointment from the IT sector, and a mixed bag of results from banks influenced investors to book profits from the table. FIIs continued to withdraw funds as the US Fed Chair emphasised the imperative for continued monetary tightening policy and hold interest rate high,” said Vinod Nair, Head of Research at Geojit Financial Services.
“Investors are likely to remain cautious in the near term due to concerns about the long implication of geopolitical tensions in the Middle East. We expect volatility to persist, although long-term investors will find bargain hunting opportunities due to an optimistic Q2 FY24 earnings estimate and a festival-driven demand environment.”
“Week ahead, market participants will vigilantly monitor US GDP data for insights into the Fed’s interest rate trajectory. Additionally, as the earnings season gains momentum, investor sentiment will be shaped by corporate’s management commentary and bottom-up investment approach,” he added.
On the sectoral front, BSE Telecom, Realty and Oil & Gas indices shed 2 percent each, while Power, Capital Goods and FMCG lost 1 percent each. On the other hand, BSE Auto index added 0.5 percent.
Foreign institutional investors (FIIs) remained seller in this week also as they sold equities worth Rs 2,799.08 crore, while domestic institutional investors (DIIs) bought equities worth Rs 3,510.97 crore. However, in the month of October the FII sold equities worth Rs 13,411.72 crore and DII sold equities worth Rs 11,883.80 crore.
The BSE Small-cap index ended flat. Nucleus Software Exports, Shakti Pumps (India), Ion Exchange (India), Newgen Software Technologies, KIOCL, Suzlon Energy, Rushil Decor and Authum Investment & Infrastucture rose more than 20 percent each.
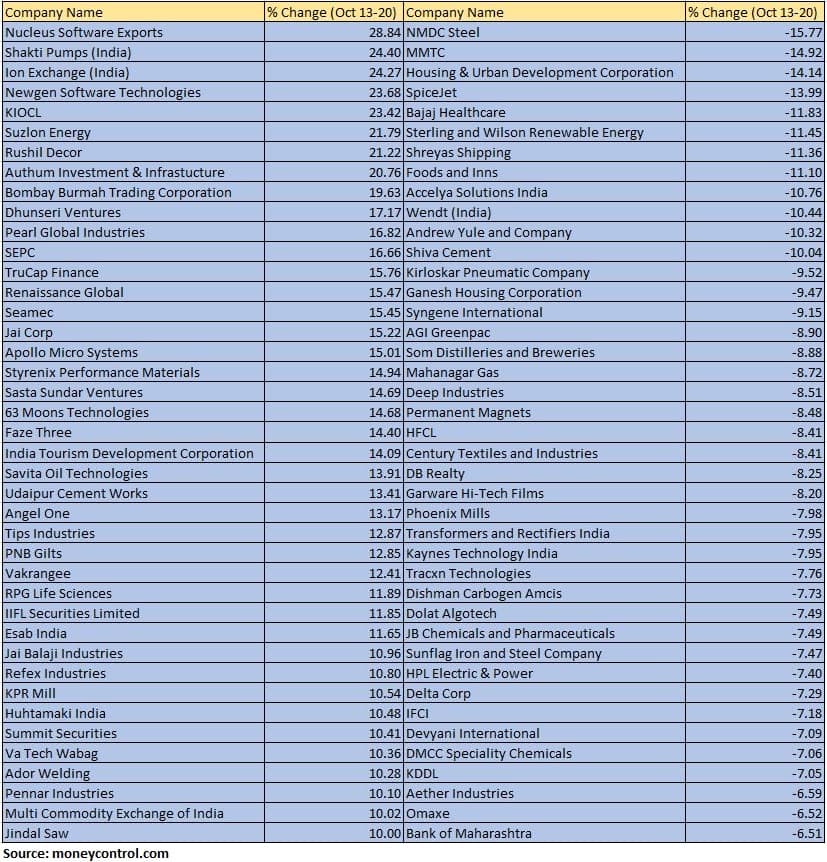
NMDC Steel, MMTC, Housing & Urban Development Corporation, SpiceJet, Bajaj Healthcare, Sterling and Wilson Renewable Energy, Shreyas Shipping, Foods and Inns, Accelya Solutions India, Wendt (India), Andrew Yule and Company and Shiva Cement shed 10-15 percent.
Where is Nifty50 headed?
Amol Athawale, Vice President – Technical Research, Kotak Securities:
If international crude prices continue their upward trajectory, investors would turn jittery and more profit-taking could be seen in the domestic equity markets in the near to medium term. Technically, on daily and intraday charts, the Nifty formed a double top formation and reversed. Post reversal, the index is comfortably trading below the 20 and 50-day SMA (Simple Moving Average) which is largely negative.
In addition, on weekly charts it has formed a bearish candle which is indicating continuation of weakness in the near future. As long as the index is trading below the 20-day SMA the weak sentiment is likely to continue. For traders, 19700 would be the immediate hurdle and below the same, the index could slip till 19450-19350. On the other side, above 19700 or 20 day SMA it could retest the level of 19800-19850.
Jatin Gedia – Technical Research Analyst at Sharekhan by BNP Paribas:
On the daily charts, Nifty is trading at the crucial support zone of 19530 – 19500 where 61.82% Fibonacci retracement level of rise from 19333 – 19850 is placed. The hourly momentum indicator is showing a positive divergence however price confirmation is missing.
The daily momentum indicator has triggered a negative crossover which is a sell signal. Considering prices are trading at crucial support levels only a breach below 19500 – 19450 zone shall lead to a sharp decline. In terms of levels, 19550 – 19500 is the crucial support zone while 19640 – 19660 shall act as an immediate hurdle zone. The Friday fall was more evident in the broad market with the Midcap index was down ~1%. The fall appears a bit overstretched in the short term and we expect a pullback during the next week.
Disclaimer: The views and investment tips expressed by experts on Moneycontrol.com are their own and not those of the website or its management. Moneycontrol.com advises users to check with certified experts before taking any investment decisions.

