F&O Buzzer | Short SBI Card; technical analyst track bearish signals
SBICARD has given breakdown of symmetric triangle on lower side. On daily chart, Stock is in
bearish trend.
Technical indicators of SBI Card scrip is showing bearish momentum and analysts suggest shorting the stock. At 1:27pm on November 8, SBI Cards and Payment Services Ltd was down 0.23 percent to Rs 751.55.
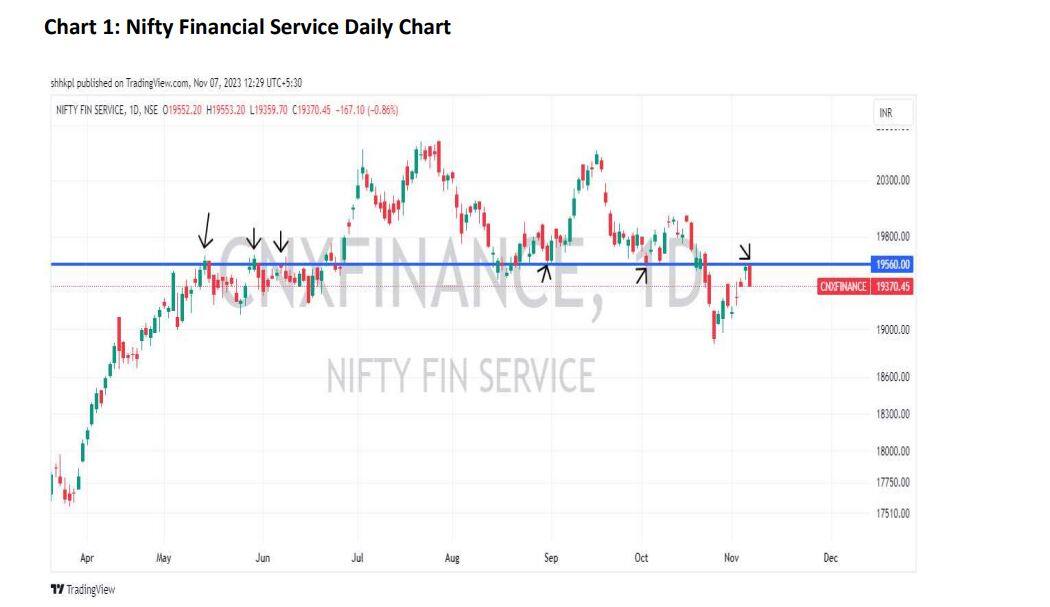
“Nifty Financial Service is in lower high and lower low sequence. With the recent upside move, the Index witnessed selling pressure at a resistance of 19560 level followed by a bearish engulfing pattern. It shows a bearish continuation sign”, stated Kapil Shah, technical analyst at Emkay Global.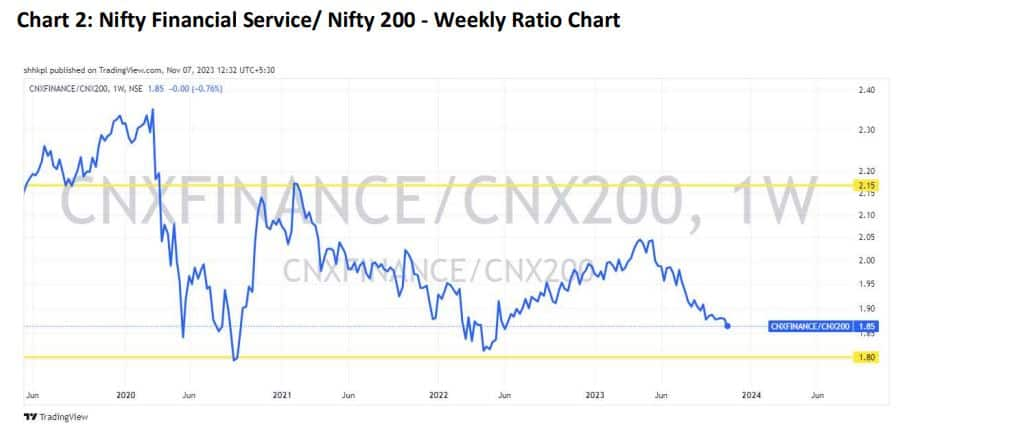
The Weekly Nifty financial services falling ratio line indicates weakness in financial services as compared to the Nifty 200 Index.
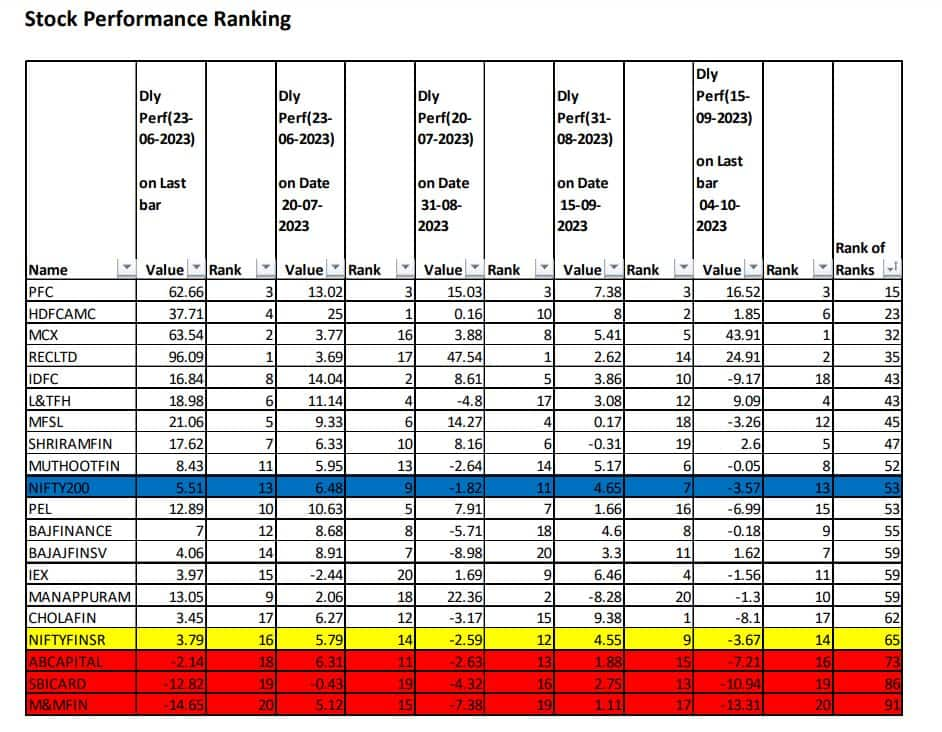
According to Kapil Shah, the time frames mentioned above are based on the upward and downward swings in Nifty 50. Stocks are assigned rankings based on their price performance in percentage terms. According to the provided data, ABCAPITAL, SBICARD, and M&M Finance have consistently underperformed.
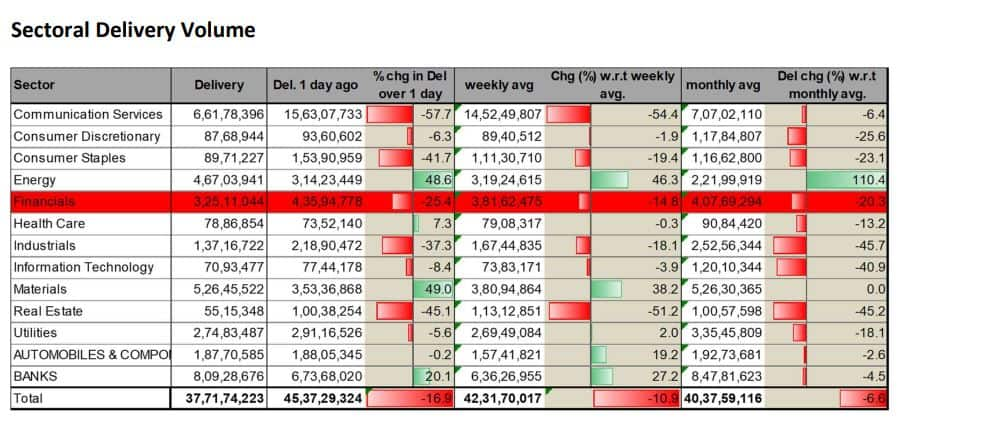
Shah highlights that sectoral delivery volume data shows a decline across the time frame.

Laggard stocks in the financial services sector display fresh short build-up or short covering across various timeframes
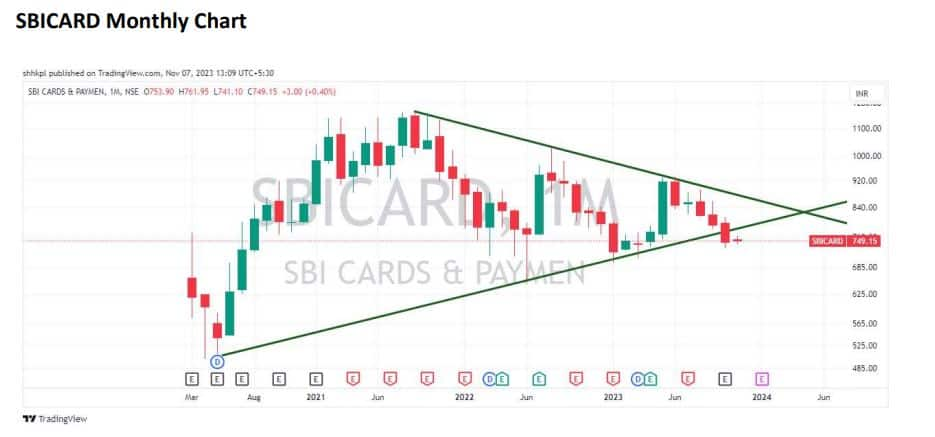
As per Kapil Shah, On the monthly chart, SBICARD has given a breakdown of a symmetric triangle on the lower side. On the daily chart, SBI card stock is in a bearish trend.
Derivative recommendation by Emkay Global
The stock offers a short opportunity at the Rs 750 level with a stop loss of 770. On the lower side, the stock can decline up to the target of Rs 710 level.
Disclaimer: The views and investment tips expressed by investment experts on Moneycontrol are their own and not those of the website or its management. Moneycontrol advises users to check with certified experts before taking any investment decisions.

