The great awakening: HDFC Bank shows cup and handle pattern breakout after 2 years of consolidation


Representative image
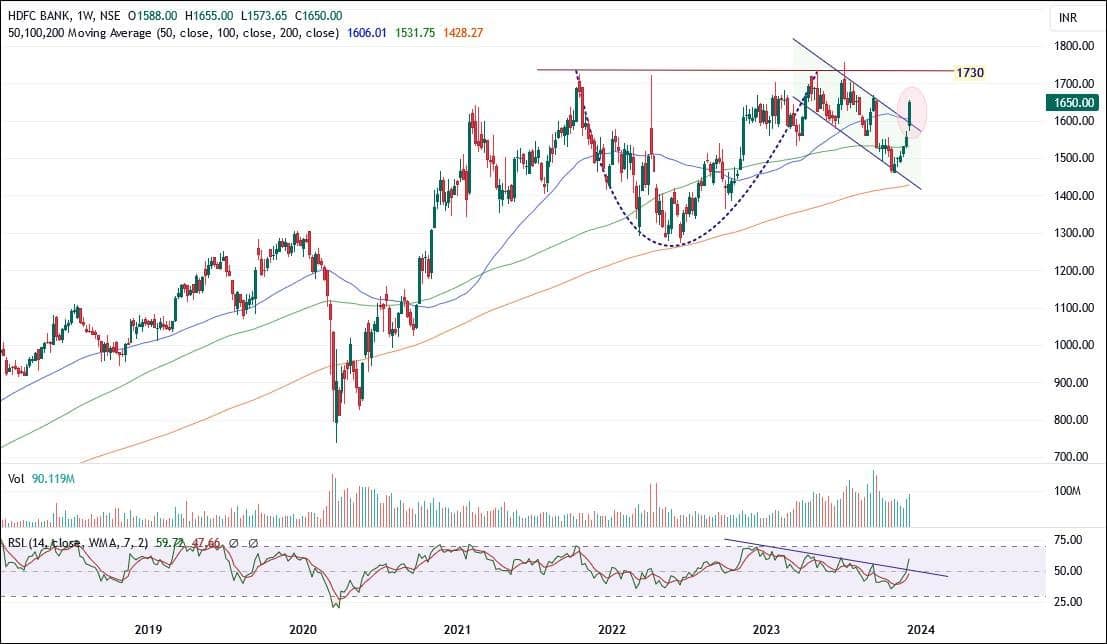
Banking major HDFC Bank’s shares surged after the RBI’s monetary policy rate decision on December 8. HDFC Bank has now formed a clear cup and handle pattern on the weekly chart and has broken out above the 1580 zone (weekly close).
On December 8, HDFC Bank closed at Rs 1,653.35 on the NSE, up Rs 22.90 or 1.40 percent.
According to Shiju Koothupalakkal, Technical Research Analyst at Prabhudas Lilladher, “After a long time and almost more than two years of consolidation, HDFC Bank formed a cup and handle pattern on the weekly chart and has broken out above the 1580 zone (weekly close).”
 Technical chart of HDFC Bank showing cup and hammer breakout pattern | Source: Prabhudas Lilladher
Levels Ahead
“Further ahead, the next major resistance zone is around 1730 levels, which has been acting as a strong hurdle for the last 2 years. The stock has moved past the 50 EMA, which is around 1605, and strong support is maintained near the important 200-period MA at 1430. A decisive weekly close above the 1730 zone shall awaken a giant towards the next higher target of 2100 levels,” added Koothupalakkal.
Recommendation: BUY
With the RSI recovering strongly from the oversold zone, indicating a decent rise to signal a buy, there is much upside potential visible from current levels. With the chart looking good, Koothupalakkal suggests buying and accumulating the stock for an upside target of 2100–2300 levels for the medium to short-term time frame.
Story continues below Advertisement
Disclaimer: The views and investment tips expressed by investment experts on Moneycontrol are their own and not those of the website or its management. Moneycontrol advises users to check with certified experts before taking any investment decisions.
Get ₹100 cashback on checking your free Credit Score on Moneycontrol. Gain valuable financial insights in just two clicks! Click here


