Nifty Auto Index surges over 2%, TVS Motors gives trendline breakout


Representative image
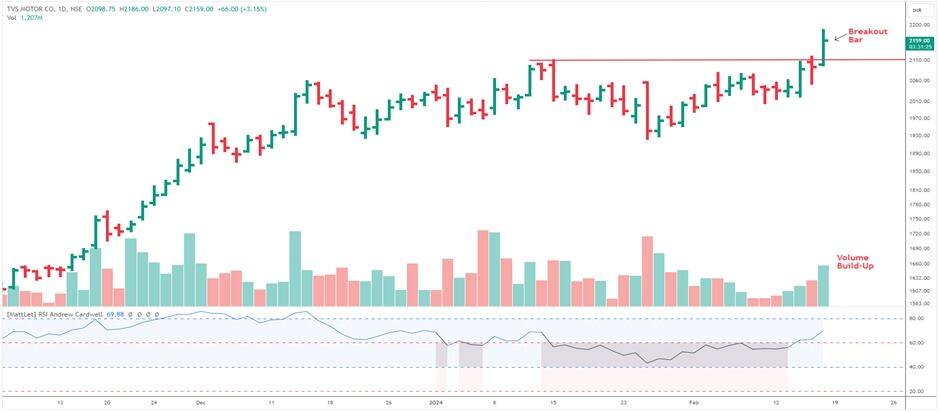
TVS Motors Ltd has given a horizontal trendline breakout on the daily scale. This breakout was confirmed by an above-50-day averages volume. The stock traded more than 9 percent above its 50-day Exponential Moving Average (EMA) and nearly 15 percent above its 100-day EMA level on February 16, indicating robust bullish momentum in the stock.
At 1pm on February 16, TVS Motors was trading at Rs 2,176 on the National Stock Exchange, up 83 points, or 4 percent, from the previous close.

According to Sudeep Shah, head of derivatives and technical research at SBI Securities, the Nifty Auto sector took the spotlight on Friday, emerging as a top performer among sectoral indices. On the daily scale, the sector has also broken out from a horizontal trendline. Shah highlighted the exceptional performance of all constituents within the index except for MRF, signalling a robust collective strength in the sector.
“Additionally, the ratio chart comparing Nifty Auto to the Nifty index has reached a 63-month high, indicating remarkable strength. Moreover, the Mansfield Relative Strength indicator has consistently remained above the zero line for the past 214 trading sessions, underscoring the sector’s resilience and growth potential.”
Shah further observed significant long build-up in derivatives, with February futures surging by 4.08 percent and Open Interest rising by nearly 9 percent. This increase in Open Interest reflects growing confidence among market participants in the stock’s potential. Analysing the option chain, Shah notes a concentration of call open interest at the 2,200 strike and considerable open interest on the put side at the 2,100 strike, suggesting bullish momentum in the stock. Call buying is seen at 2,340-2,120 CE strikes, while put writing is evident in 2,200-2,060 strike, further indicating a bullish sentiment.
Momentum indicators and oscillators echo a similar bullish sentiment. The daily RSI is in the super bullish zone and on a rising trajectory. The MACD remains bullish, quoting above its zero line and signal line, with the MACD histogram indicating an increase in upside momentum. Volume-based indicators like OBV and Money Flow Index also show an uptick, supporting the bullish outlook.
These technical and derivative factors are aligning in favour of bulls. Hence, Shah recommends to accumulate the stock in the zone of Rs 2135-2150 with the stop loss of 2070. On the upside, it is likely to test the level of Rs 2270, followed by 2320 in short-term.
Story continues below Advertisement
Disclaimer: The views and investment tips expressed by investment experts on Moneycontrol.com are their own and not those of the website or its management. Moneycontrol.com advises users to check with certified experts before taking any investment decisions.


