Russell 2000 Breaks Out: Why History Says Stocks Could Soar From Here
- Stock Market Stocks to buy Stocks to sell
admin
- 0
- 10 minutes read


Over much of the past three years, small-cap stocks have been the waif of Wall Street: the most neglected corner of the market, untouchable to most.
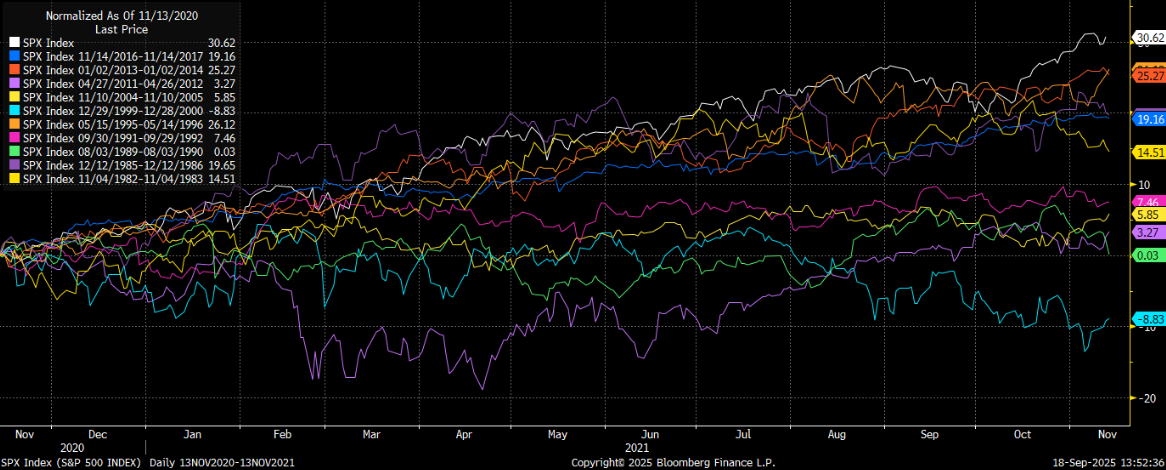
Coming out of the COVID-19 crash, the Russell 2000 was a rocket ship. Between early 2020 and late 2021, the index soared nearly 150% as traders piled into every speculative growth name they could find.
But then the inflation hammer dropped. Sticky consumer prices forced the Federal Reserve into one of the most aggressive tightening cycles in history. That put small caps – the most economically sensitive and debt-reliant companies in the market – squarely in the danger zone.
Throughout 2022, those stocks were crushed. Even in 2023 and ’24, while the S&P 500 and Nasdaq marched to new highs on AI euphoria, small caps languished. They remained pinned by higher rates – then were punished further by tariffs here in 2025.
All told, the Russell 2000 spent nearly four years stuck in the mud.
But this week, that changed.
The index surged more than 2.5% to 2,468, eclipsing its record high of 2,443 from November 2021. Powered by a combination of rate cuts, tame inflation, fading tariff threats, and the prospect of economic deregulation, small caps finally hit a new record.
For the first time in years, small caps have joined the rally.
And it could be the single most bullish signal we’ve seen in ages…
The Russell 2000’s Breakout Signal – and What History Tells Us Next
This is a big deal for everyone invested in stocks.
Small caps are considered the riskiest corner of the equity market. When investors are feeling nervous, they avoid them. When they feel confident about the economy and the future, they pile in.
So, small-cap breakouts act like a sentiment thermometer. If small caps are running, it usually means risk appetite is high, credit fears are low, and growth expectations are strong.
That bullish backdrop tends to lift the entire stock market.
We’ve analyzed the market’s historical data, going back to 1980, and looked at every instance when the Russell 2000 hit a new all-time high for the first time in over a year.
There were 11 such occasions.
Here’s what happened next:
- In 10 of those 11 instances, the S&P 500 was higher one year later.
- The average return? About 15%.
The historical data overwhelmingly confirms that when small caps finally break out, the whole market tends to rally hard over the next 12 months.
And this week, the Russell 2000 broke out.
That means the clock just started on what should be another strong year for stocks – especially for one sector in particular…
AI and Small Caps: A One-Two Punch for the Market Rally
Of course, while the small-cap breakout is the broad-market signal, the strongest gains will still be concentrated in the tech sector, especially AI stocks.
Why? The news flow is unstoppable.
In one day alone – Thursday, Sept. 18, 2025 – we learned that:
- Nvidia (NVDA) invested $5 billion into Intel to accelerate AI data center chip development.
- Microsoft (MSFT) committed $4 billion to building a new AI data center in Wisconsin.
- Palantir (PLTR) signed a £1.5 billion AI partnership with the U.K. government.
- CrowdStrike (CRWD) unveiled a cutting-edge suite of AI-powered cybersecurity products at its Las Vegas conference.
- Rigetti Computing (RGTI) secured a $5.8 million contract with the U.S. Air Force for quantum AI work.
- Meta (META) unveiled its futuristic AI glasses, complete with holographic displays controlled by subtle wristband movements.
That’s like a tidal wave of validation for the AI Boom. It’s powerful. It’s accelerating – and it’s a global phenomenon.
Yet, that tidal wave of AI momentum is only the tip of the spear – because while the headlines capture Big Tech’s splash, the real wealth-building signals often emerge in the quieter corners of innovation.
Russell 2000 Breakout + AI = Meltup Setup
For years, small caps have been the missing piece of the bullish puzzle: the one major corner of the market that never confirmed the bull run in mega-cap tech.
But now, with the Russell 2000 finally breaking out, the market has a lot of room to run. Past precedents point to 15% gains in the S&P 500 over the next 12 months.
Layer that on top of the AI tidal wave – where trillion-dollar hyperscalers are pouring billions into data centers, chips, and software every single week – and you have the recipe for a major market meltup.
It’s time to party.
But as always, the best seats at this market party are still in AI stocks.
If you’re not already super-long AI, this is your cue.
One of the highest-potential areas within that cohort? Humanoid robotics.
This emerging tech is shaping up to be the next trillion-dollar frontier. Goldman Sachs (GS) projects the global humanoid robot market could reach $38 billion by 2035. And Fortune Business Insights estimates the sector will grow even faster, reaching $66 billion by 2032.
But the story isn’t just about a handful of futuristic robots walking factory floors; it’s about eventual ubiquity. By the end of this decade, humanoids could be in warehouses, hospitals, and even households, reshaping how labor gets done.
The smartest money isn’t just chasing the flashy brands. It’s following the companies building the vital components – actuators, sensors, AI control systems – that every humanoid will need. These suppliers sit in the same position as chipmakers did at the dawn of the PC revolution: indispensable, scalable, and massively profitable when adoption explodes.
One supplier in particular could become the linchpin of this entire movement. As Tesla (TSLA) ramps its Optimus humanoid project, this little-known partner stands to ride every incremental sale, contract, and deployment. And investors who get in before that scaling wave could be sitting on the most lucrative play of the robotics era.
Click here now to see why this overlooked firm could soar as Optimus becomes reality.


