Larsen & Toubro’s trendline breakout signals accumulation


L&T ratio chart compared to the Nifty is marking the sequence of higher tops and higher bottoms
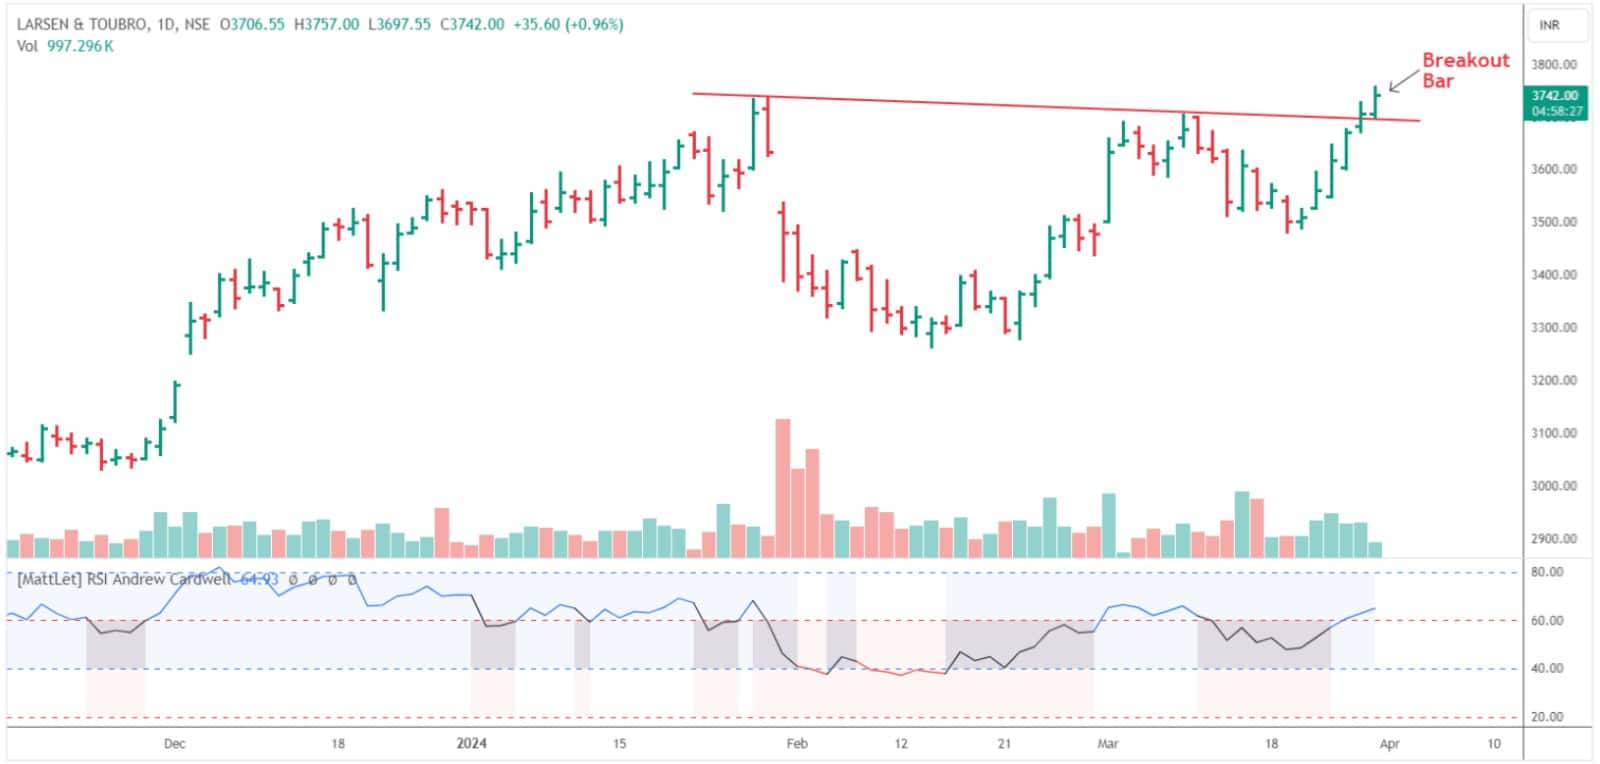
Shares of Larsen & Toubro’s were trading higher on March 28 afternoon after a downward sloping trendline breakout on the daily scale.
The stock has been outperforming the frontline indices for the last couple of trading sessions. The ratio chart of the stock compared to the benchmark Nifty is also marking the sequence of higher tops and higher bottoms.
 Technical chart showing downward sloping trendline breakout| Source: SBI Securities
Sudeep Shah, DVP and head of derivative and technical research at SBI Securities, said, “The trendline was formed by connecting swing highs from January 2024. As the stock is trading at an all-time high, all the moving averages and momentum-based indicators are suggesting bullish momentum in the stock. The daily RSI is in the bullish zone as per RSI range shift rules.”
The Mansfield’s relative strength indicator has consistently remained above the zero line for the past 25 trading sessions, indicating sustained and robust outperformance, Shah said.
Also read: Bank Nifty, Nifty rollover data suggests aggressive long bets for April series
On the derivative front, too, data is aligning with the prevailing bullish chart structure with March futures gaining nearly 1 percent and cumulative open interest of current, next and far series dipping by 3.31 percent, indicating overall short covering.
Shah recommends accumulating L&T in the Rs 3,750-3,730 zone, with the stop loss of Rs 3,620. On the upside, it is likely to test Rs 3,930 followed by Rs 4,000 in the short term.
Story continues below Advertisement
Disclaimer: The views and investment tips expressed by investment experts on Moneycontrol.com are their own and not those of the website or its management. Moneycontrol.com advises users to check with certified experts before taking any investment decisions.


