Varroc Engineering signals Buy post Inverted Head and Shoulder breakout: Axis Securities


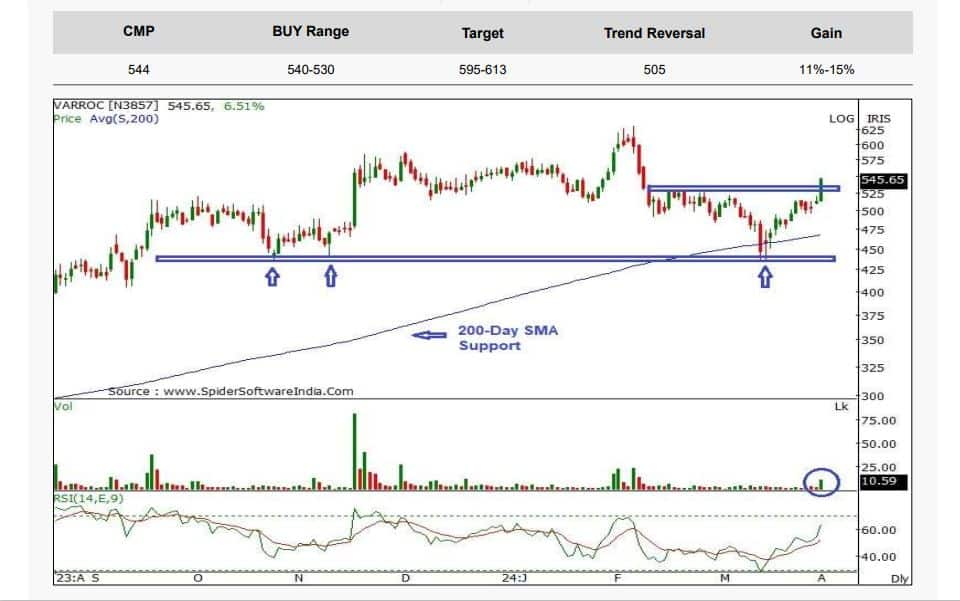
Axis Securities recommends accumulating Varroc Engineering in the Rs 540-530 range, with a target price of Rs 595, offering an upside potential of 11-15 percent.
Varroc Engineering Ltd is engaged in the business of manufacturing and supplying automobile components to a wide range of OEMs across the globe
‘);
$(‘#lastUpdated_’+articleId).text(resData[stkKey][‘lastupdate’]);
//if(resData[stkKey][‘percentchange’] > 0){
// $(‘#greentxt_’+articleId).removeClass(“redtxt”).addClass(“greentxt”);
// $(‘.arw_red’).removeClass(“arw_red”).addClass(“arw_green”);
//}else if(resData[stkKey][‘percentchange’] < 0){
// $(‘#greentxt_’+articleId).removeClass(“greentxt”).addClass(“redtxt”);
// $(‘.arw_green’).removeClass(“arw_green”).addClass(“arw_red”);
//}
if(resData[stkKey][‘percentchange’] >= 0){
$(‘#greentxt_’+articleId).removeClass(“redtxt”).addClass(“greentxt”);
//$(‘.arw_red’).removeClass(“arw_red”).addClass(“arw_green”);
$(‘#gainlosstxt_’+articleId).find(“.arw_red”).removeClass(“arw_red”).addClass(“arw_green”);
}else if(resData[stkKey][‘percentchange’] < 0){
$(‘#greentxt_’+articleId).removeClass(“greentxt”).addClass(“redtxt”);
//$(‘.arw_green’).removeClass(“arw_green”).addClass(“arw_red”);
$(‘#gainlosstxt_’+articleId).find(‘.arw_green’).removeClass(“arw_green”).addClass(“arw_red”);
}
$(‘#volumetxt_’+articleId).show();
$(‘#vlmtxt_’+articleId).show();
$(‘#stkvol_’+articleId).text(resData[stkKey][‘volume’]);
$(‘#td-low_’+articleId).text(resData[stkKey][‘daylow’]);
$(‘#td-high_’+articleId).text(resData[stkKey][‘dayhigh’]);
$(‘#rightcol_’+articleId).show();
}else{
$(‘#volumetxt_’+articleId).hide();
$(‘#vlmtxt_’+articleId).hide();
$(‘#stkvol_’+articleId).text(”);
$(‘#td-low_’+articleId).text(”);
$(‘#td-high_’+articleId).text(”);
$(‘#rightcol_’+articleId).hide();
}
$(‘#stk-graph_’+articleId).attr(‘src’,’//appfeeds.moneycontrol.com/jsonapi/stocks/graph&format=json&watch_app=true&range=1d&type=area&ex=’+stockType+’&sc_id=’+stockId+’&width=157&height=100&source=web’);
}
}
}
});
}
$(‘.bseliveselectbox’).click(function(){
$(‘.bselivelist’).show();
});
function bindClicksForDropdown(articleId){
$(‘ul#stockwidgettabs_’+articleId+’ li’).click(function(){
stkId = jQuery.trim($(this).find(‘a’).attr(‘stkid’));
$(‘ul#stockwidgettabs_’+articleId+’ li’).find(‘a’).removeClass(‘active’);
$(this).find(‘a’).addClass(‘active’);
stockWidget(‘N’,stkId,articleId);
});
$(‘#stk-b-‘+articleId).click(function(){
stkId = jQuery.trim($(this).attr(‘stkId’));
stockWidget(‘B’,stkId,articleId);
$(‘.bselivelist’).hide();
});
$(‘#stk-n-‘+articleId).click(function(){
stkId = jQuery.trim($(this).attr(‘stkId’));
stockWidget(‘N’,stkId,articleId);
$(‘.bselivelist’).hide();
});
}
$(“.bselivelist”).focusout(function(){
$(“.bselivelist”).hide(); //hide the results
});
function bindMenuClicks(articleId){
$(‘#watchlist-‘+articleId).click(function(){
var stkId = $(this).attr(‘stkId’);
overlayPopupWatchlist(0,2,1,stkId);
});
$(‘#portfolio-‘+articleId).click(function(){
var dispId = $(this).attr(‘dispId’);
pcSavePort(0,1,dispId);
});
}
$(‘.mc-modal-close’).on(‘click’,function(){
$(‘.mc-modal-wrap’).css(‘display’,’none’);
$(‘.mc-modal’).removeClass(‘success’);
$(‘.mc-modal’).removeClass(‘error’);
});
function overlayPopupWatchlist(e, t, n,stkId) {
$(‘.srch_bx’).css(‘z-index’,’999′);
typparam1 = n;
if(readCookie(‘nnmc’))
{
var lastRsrs =new Array();
lastRsrs[e]= stkId;
if(lastRsrs.length > 0)
{
var resStr=”;
let secglbVar = 1;
var url = ‘//www.moneycontrol.com/mccode/common/saveWatchlist.php’;
$.get( “//www.moneycontrol.com/mccode/common/rhsdata.html”, function( data ) {
$(‘#backInner1_rhsPop’).html(data);
$.ajax({url:url,
type:”POST”,
dataType:”json”,
data:{q_f:typparam1,wSec:secglbVar,wArray:lastRsrs},
success:function(d)
{
if(typparam1==’1′) // rhs
{
var appndStr=”;
//var newappndStr = makeMiddleRDivNew(d);
//appndStr = newappndStr[0];
var titStr=”;var editw=”;
var typevar=”;
var pparr= new Array(‘Monitoring your investments regularly is important.’,’Add your transaction details to monitor your stock`s performance.’,’You can also track your Transaction History and Capital Gains.’);
var phead =’Why add to Portfolio?’;
if(secglbVar ==1)
{
var stkdtxt=’this stock’;
var fltxt=’ it ‘;
typevar =’Stock ‘;
if(lastRsrs.length>1){
stkdtxt=’these stocks’;
typevar =’Stocks ‘;fltxt=’ them ‘;
}
}
//var popretStr =lvPOPRHS(phead,pparr);
//$(‘#poprhsAdd’).html(popretStr);
//$(‘.btmbgnwr’).show();
var tickTxt =’‘;
if(typparam1==1)
{
var modalContent = ‘Watchlist has been updated successfully.’;
var modalStatus = ‘success’; //if error, use ‘error’
$(‘.mc-modal-content’).text(modalContent);
$(‘.mc-modal-wrap’).css(‘display’,’flex’);
$(‘.mc-modal’).addClass(modalStatus);
//var existsFlag=$.inArray(‘added’,newappndStr[1]);
//$(‘#toptitleTXT’).html(tickTxt+typevar+’ to your watchlist’);
//if(existsFlag == -1)
//{
// if(lastRsrs.length > 1)
// $(‘#toptitleTXT’).html(tickTxt+typevar+’already exist in your watchlist’);
// else
// $(‘#toptitleTXT’).html(tickTxt+typevar+’already exists in your watchlist’);
//
//}
}
//$(‘.accdiv’).html(”);
//$(‘.accdiv’).html(appndStr);
}
},
//complete:function(d){
// if(typparam1==1)
// {
// watchlist_popup(‘open’);
// }
//}
});
});
}
else
{
var disNam =’stock’;
if($(‘#impact_option’).html()==’STOCKS’)
disNam =’stock’;
if($(‘#impact_option’).html()==’MUTUAL FUNDS’)
disNam =’mutual fund’;
if($(‘#impact_option’).html()==’COMMODITIES’)
disNam =’commodity’;
alert(‘Please select at least one ‘+disNam);
}
}
else
{
AFTERLOGINCALLBACK = ‘overlayPopup(‘+e+’, ‘+t+’, ‘+n+’)’;
commonPopRHS();
/*work_div = 1;
typparam = t;
typparam1 = n;
check_login_pop(1)*/
}
}
function pcSavePort(param,call_pg,dispId)
{
var adtxt=”;
if(readCookie(‘nnmc’)){
if(call_pg == “2”)
{
pass_sec = 2;
}
else
{
pass_sec = 1;
}
var postfolio_url = ‘https://www.moneycontrol.com/portfolio_new/add_stocks_multi.php?id=’+dispId;
window.open(postfolio_url, ‘_blank’);
} else
{
AFTERLOGINCALLBACK = ‘pcSavePort(‘+param+’, ‘+call_pg+’, ‘+dispId+’)’;
commonPopRHS();
/*work_div = 1;
typparam = t;
typparam1 = n;
check_login_pop(1)*/
}
}
function commonPopRHS(e) {
/*var t = ($(window).height() – $(“#” + e).height()) / 2 + $(window).scrollTop();
var n = ($(window).width() – $(“#” + e).width()) / 2 + $(window).scrollLeft();
$(“#” + e).css({
position: “absolute”,
top: t,
left: n
});
$(“#lightbox_cb,#” + e).fadeIn(300);
$(“#lightbox_cb”).remove();
$(“body”).append(”);
$(“#lightbox_cb”).css({
filter: “alpha(opacity=80)”
}).fadeIn()*/
$(“.linkSignUp”).click();
}
function overlay(n)
{
document.getElementById(‘back’).style.width = document.body.clientWidth + “px”;
document.getElementById(‘back’).style.height = document.body.clientHeight +”px”;
document.getElementById(‘back’).style.display = ‘block’;
jQuery.fn.center = function () {
this.css(“position”,”absolute”);
var topPos = ($(window).height() – this.height() ) / 2;
this.css(“top”, -topPos).show().animate({‘top’:topPos},300);
this.css(“left”, ( $(window).width() – this.width() ) / 2);
return this;
}
setTimeout(function(){$(‘#backInner’+n).center()},100);
}
function closeoverlay(n){
document.getElementById(‘back’).style.display = ‘none’;
document.getElementById(‘backInner’+n).style.display = ‘none’;
}
stk_str=”;
stk.forEach(function (stkData,index){
if(index==0){
stk_str+=stkData.stockId.trim();
}else{
stk_str+=’,’+stkData.stockId.trim();
}
});
$.get(‘//www.moneycontrol.com/techmvc/mc_apis/stock_details/?classic=true&sc_id=’+stk_str, function(data) {
stk.forEach(function (stkData,index){
$(‘#stock-name-‘+stkData.stockId.trim()+’-‘+article_id).text(data[stkData.stockId.trim()][‘nse’][‘shortname’]);
});
});
function redirectToTradeOpenDematAccountOnline(){
if (stock_isinid && stock_tradeType) {
window.open(`https://www.moneycontrol.com/open-demat-account-online?classic=true&script_id=${stock_isinid}&ex=${stock_tradeType}&site=web&asset_class=stock&utm_source=moneycontrol&utm_medium=articlepage&utm_campaign=tradenow&utm_content=webbutton`, ‘_blank’);
}
}
Varroc Engineering shares surged eight percent at 3 pm on April 2, after the counter demonstrated an Inverted Head and Shoulders breakout. According to Axis Securities, heightened volume activity in the scrip was observed at the breakout, further amplifying market participation and reinforcing the significance of the breakout.
Technical chart of Varroc Engineering displaying the Inverted Head and Shoulders breakout.

“Varroc has demonstrated a significant breakout above the neckline of the ‘Inverted Head & Shoulders’ pattern at 520 with a robust bullish candle, signaling a potential shift from a downtrend to a positive trajectory,” said Axis Securities. The heightened volume activity witnessed at the breakout further amplifies market participation, reinforcing the significance of the breakout.
Also read: F&O Manual | Indices consolidate at higher levels, Nifty sees support at 22,425
The brokerage firm highlights the stock’s ability to maintain levels above key short- and medium-term moving averages (20, 50, 100, and 200 days), signaling a positive bias in its trajectory.
“The daily Relative Strength Index (RSI) remains in bullish territory, holding above both its reference line and the 50 mark, reinforcing a positive bias in the stock,” added Axis Securities.
The brokerage house believes that with the breakout from the Inverted Head and Shoulders pattern, the stock is anticipated to rally towards previous swing highs, setting targets at Rs 595 and Rs 613.
Story continues below Advertisement
It recommends accumulating the stock in the Rs 540-530 range, with a target price of Rs 595, offering an upside potential of 11-15 percent.
Disclaimer: The views and investment tips expressed by investment experts on Moneycontrol.com are their own and not those of the website or its management. Moneycontrol.com advises users to check with certified experts before taking any investment decisions.


